
Search for the average personal injury settlement and you will find numbers all over the map, from thirty thousand dollars to well over a million. They are not wrong. They are not contradicting each other by accident either. Each one measures a different slice of cases, and figuring out which slice yours falls into matters far more than chasing a single national average.
Disclaimer: This guide is for informational purposes only and is not legal advice. Settlement values depend on jurisdiction, injury severity, liability, available insurance coverage, comparative fault, and applicable damage caps. Figures cited are published survey and industry data, not predictions about any individual case. Consult a licensed attorney in your state before accepting or rejecting an offer.
There is no single average. The published figures disagree by a factor of more than thirty, and that is not a mistake. Each one measures a different pool of cases. Insurance Research Council data puts the median motor vehicle settlement at roughly $31,000. Analysis of publicly reported settlements shows a median of $1.05 million, but that sample only includes cases big enough that somebody bothered to publish them. What actually shapes your number is the multiplier applied to your economic damages, how much fault you carry, and the insurance policy limit, a hard ceiling that does not care how severe your injuries are. Use our free Personal Injury Calculator to work through your own numbers.
Why the Published Averages Disagree
This is worth understanding before anything else, because once you see it, the conflicting numbers stop being confusing and start being obvious.
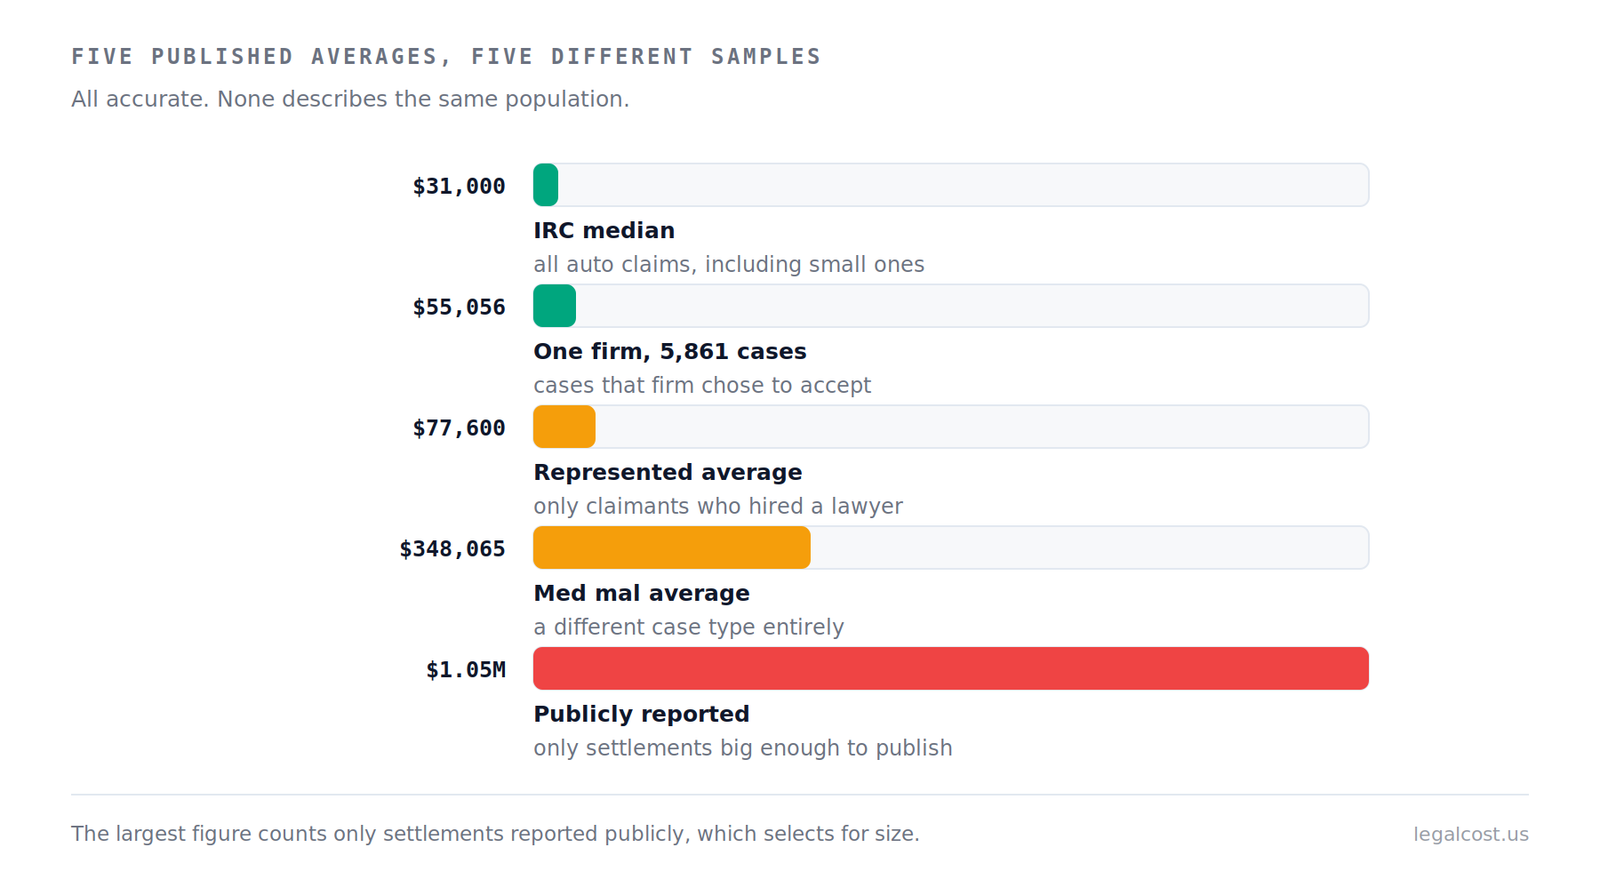
All five figures are accurate. None of them describes the same population, and none of them predicts an individual case.
That last figure gets the most attention, and it is worth a closer look. A median of $1.05 million sounds like what most people walk away with. It is what most people walk away with among settlements that made the news or landed in a public database. Small settlements never get reported. Nobody writes a press release about a $14,000 fender bender payout. So the sample is built from the top of the distribution by design.
The IRC median of $31,000 sits at the other end, and it is actually closer to what a routine claim looks like. It counts the minor soft tissue cases, the quick settlements, and all the other claims that the bigger-sounding datasets quietly filter out.
How the Number Is Actually Built
Adjusters do not pull a number out of thin air. Most large insurers run claims through valuation software like Colossus or Claims IQ, which spits out a range. The adjuster negotiates within that range, not above it and not below it without justification. The inputs feeding the software are the same variables any experienced attorney would use by hand.
Step one: economic damages
Add up every documented financial loss: past and future medical treatment, lost wages, reduced earning capacity, property damage. These are your special damages, and they anchor everything that follows. Get this number wrong and the entire calculation drifts from here.
Step two: the multiplier
This is where it gets interesting. Economic damages are multiplied by a factor between 1.5 and 5 to put a dollar amount on pain, suffering, and loss of enjoyment. A strained neck with a few weeks of physical therapy sits near 1.5. Surgery or six months of recovery pushes it toward 3. Permanent disability reaches 5. This multiplier is the single most argued-over number in any settlement discussion, and it is the spot where having an attorney changes the outcome most.
One thing to be aware of: some adjusters apply the multiplier only to medical specials rather than to the full economic total including lost wages. Practice varies by insurer and region, and it is one of those details worth nailing down early in any negotiation.
Step three: comparative fault
Your share of responsibility reduces the figure, and the rule differs by state. Pure comparative negligence states like California and New York reduce the award by your percentage with no cut-off. Modified comparative states, which now include Florida since its 2023 tort reform, bar recovery entirely once you hit 50 or 51 percent depending on the state. And then a handful of contributory negligence jurisdictions bar recovery for any fault at all, meaning one percent responsibility wipes out the claim entirely.
Step four: the policy limit
This is the real ceiling, and it overrides every other number in the calculation. It gets its own section below because it is the factor that blindsides people most often.
Economic damages, multiplier, comparative fault and net after fees, in one calculation.
Open the Personal Injury CalculatorThe Policy Limit Is the Real Ceiling
This is the part that catches people off guard, and it usually surfaces late in the process after expectations have already formed around a much bigger number.
Insurance policy limits cap your recovery regardless of how badly you were hurt. A claim genuinely worth $200,000 against a driver who carries only $50,000 in liability coverage is, in practice, a $50,000 claim. How severe your injuries are does not change that math one bit.
Same injury, same medical bills, same pain. The $150,000 difference comes down to which insurance card the other driver happened to be carrying.
You can actually see this effect in aggregate data. Analysis of publicly reported dog bite settlements found the figures clustering tightly between $300,000 and $310,000, a much narrower band than the range of injuries would predict. That clustering is what a policy limit looks like from above. The cases are not being valued on their individual facts. They are being paid out to the ceiling and stopping there.
Can you sue the individual personally for the amount above their policy limit? Legally, yes. Practically, it is almost never worth it. A defendant carrying minimum coverage usually has minimum assets to go with it, and a judgment you cannot collect is a piece of paper, not compensation.
Typical Ranges by Case Type
With all of the above in mind, published data does show some consistent patterns between case categories. The differences boil down to three things: how severe the injuries tend to be, how easy or hard it is to prove liability, and how much insurance coverage is typically sitting behind the defendant.
| Case type | Published figure | Source and note |
|---|---|---|
| Motor vehicle | ~$31,000 median | Insurance Research Council. Represented claimants average around $77,600. |
| Slip and fall | $10,000 to $50,000 typical | Lower because liability is harder to prove. Surgery cases run $100,000 to $400,000. |
| Dog bite | ~$69,272 average claim | Insurance Information Institute, from about $1.57 billion in total industry payouts. |
| Medical malpractice | ~$348,065 average payout | National Practitioner Data Bank. Cases reaching trial average close to $1 million. |
| Commercial truck | Substantially higher | Federal carrier regulations, larger policies and employer liability all push these up. |
| Wrongful death | $500,000 to $1 million typical | Driven by the decedent's age, earnings and dependants. Verdicts frequently exceed this. |
Two patterns jump out. Slip and fall settles lowest of the common categories, and not because the injuries are milder. It is because proving the property owner knew about the hazard, or should have known, is genuinely difficult. Maintenance logs and surveillance footage move these cases more than anything else, and without them, liability is an uphill fight.
Commercial defendants pay more than individuals at the same injury severity, and the gap is wide. That is a coverage effect more than a fairness effect. A commercial policy simply has room that a personal auto policy does not.
Sources: Insurance Research Council settlement data, Insurance Information Institute homeowners and auto claim statistics, National Practitioner Data Bank malpractice payout reports, Martindale-Nolo survey of personal injury victims. Updated July 2026. Published averages reflect the sample each study draws from and do not predict individual outcomes.
What Representation Changes
The data on this is unusually consistent across studies. Represented claimants recover roughly 3.5 times more than those who handle the claim themselves.
That is a big enough gap to be worth explaining, because it is not one dramatic courtroom moment. It is the accumulation of smaller advantages at each step of the calculation laid out above.
Finding all the coverage
This is the most valuable thing an attorney does and the one that is hardest to see from the outside. If a second policy exists and nobody looks for it, the ceiling stays low no matter how well the rest of the claim is argued.
Documenting the multiplier
The difference between a multiplier of 2 and a multiplier of 3 on $37,000 in economic damages is $37,000 in real money. Moving that number requires medical records that describe functional limitation, not just treatment dates, and it is more of a documentation exercise than an argument. An attorney knows what the records need to say and how to get the treating physician to say it.
Capturing future losses
People handling their own claims tend to settle based on the bills sitting on their kitchen table. Future treatment costs and reduced earning capacity are frequently the larger number, and an adjuster is never going to volunteer those figures. You have to know to ask, and you have to know how to document them.
Negotiating the liens down
This is one that changes the net without touching the gross. Medicare frequently reduces its claim by 20 to 40 percent in exchange for a quick, guaranteed payment, and private subrogation liens are often negotiable too. None of this shows up in the headline settlement number, but every dollar saved goes straight to the client.
A word of caution on that 3.5x number. Represented claimants also tend to have more serious injuries in the first place, because people with minor claims are less likely to hire a lawyer. Some of the gap is selection bias rather than pure attorney effect. The direction of the effect is well established across every study that has looked at it, even if the exact multiple overstates what a lawyer adds to any individual case.
The Gross Is Not What You Keep
Every figure quoted so far is a gross settlement. Three layers of deductions sit between that number and the money that actually hits your bank account.
That works out to about 45 percent of the gross, which is squarely in the normal range. After the attorney fee, case expenses, and liens, most plaintiffs end up netting between 40 and 60 percent of the headline figure.
So when someone tells you their case settled for $112,000, the money that actually reached them was closer to $50,000. Both numbers are accurate. Only one of them is spendable.
For a full breakdown of how contingency fees work, including the gross versus net calculation basis that can move thousands on its own, see our guide to what personal injury lawyers take and why.
Once you settle, the terms belong in a signed settlement agreement. If the offer came before you finished medical treatment, get a lawyer to review it first.
Prepare your Settlement Agreement on LawDepotAffiliate link: LegalCost.us earns a commission from LawDepot at no extra cost to you.
Why It Takes as Long as It Does
The single most important timing concept is maximum medical improvement, or MMI. That is the point where your condition has stabilized enough that doctors can estimate what your future care needs will actually cost.
A case cannot be valued accurately before you get there. Settling early means you are accepting a figure based on the treatment you have already had, not the treatment you are going to need. And settlements are final. There is no reopening a claim because a surgery became necessary six months down the road.
Most motor vehicle claims resolve within several months to about a year. Medical malpractice runs quite a bit longer, frequently tacking on another 18 to 36 months, because expert testimony and standard-of-care analysis simply take time that cannot be squeezed.
Roughly 95 percent of personal injury cases settle before ever reaching a courtroom, which is why your negotiating position matters far more than trial performance in practice.
Tax Treatment, and the Surprise Inside It
Most of a personal injury settlement is not taxable, which puts it in a very different position from almost every other kind of legal recovery.
Internal Revenue Code section 104(a)(2) excludes from gross income damages received on account of personal physical injuries or physical sickness. The default rule under section 61 is that all income is taxable, and this is one of the few carve-outs.
Punitive damages are taxed regardless
Even inside a physical injury case where everything else is excluded, any punitive portion is included in gross income. The exclusion in section 104(a)(2) applies to compensatory damages only, and this is the most misunderstood part of settlement taxation.
Emotional distress depends entirely on what caused it
Distress arising from a physical injury is excluded along with everything else. Distress standing alone is taxable, even where it produces physical symptoms such as headaches or insomnia. The statute was amended in 1996 to insert the word physical precisely to draw this line, and it has been litigated ever since.
Interest is always taxable
Pre-judgment and post-judgment interest fall under the general rule in section 61 rather than the exclusion. On a settlement that took two years to resolve, the interest component can be substantial and it is taxed as ordinary income.
Allocation is where the money is: The settlement agreement should state clearly how the total is divided between physical injury compensation, punitive damages and interest. On a $200,000 settlement, allocating $150,000 to physical injury and $50,000 to punitive means only the $50,000 reaches your tax return. An agreement that is silent or vague on allocation invites the IRS to take a less favourable view. This is worth resolving before signing rather than at the point of filing.
Sources: Internal Revenue Code sections 61 and 104(a)(2), Treasury Regulation 1.104-1(c), Small Business Job Protection Act of 1996 (PL 104-188), IRS guidance on the tax implications of settlements and judgments. Updated July 2026. Tax treatment turns on the specific facts and allocation; consult a tax professional before signing a settlement agreement.
Damage Caps
A number of states limit non-economic damages by statute, and when a cap applies, it overrides the entire calculation regardless of the underlying facts.
Caps show up most often in medical malpractice, where a majority of states impose some limit on what can be awarded for pain and suffering. Punitive damages are capped separately in many states as well. Georgia, for instance, limits them to $250,000 under O.C.G.A. section 51-12-5.1. South Carolina caps them at three times compensatory damages or $500,000, whichever is greater, under section 15-32-530.
Economic damages, your documented medical costs and lost earnings, are generally not capped anywhere. That distinction matters a great deal when you are valuing a case in a capped state, because it shifts the entire strategy toward proving concrete financial losses rather than arguing severity of suffering.
Sources: State damage cap statutes including O.C.G.A. section 51-12-5.1 and S.C. Code section 15-32-530, Insurance Research Council representation studies, Centers for Medicare and Medicaid Services conditional payment recovery guidance. Updated July 2026. Caps change by legislation and court challenge; confirm current law in your state.
Frequently Asked Questions
What is the average personal injury settlement?
There is no single answer, and that is not a cop-out. The published figures disagree by a factor of more than thirty because they are each counting different pools of cases. Insurance Research Council data puts the median motor vehicle settlement at roughly $31,000. One firm reports $55,056 across nearly 6,000 of its own cases. A 2026 analysis of publicly reported settlements came in at a median of $1.05 million. All three are real numbers. The million-dollar figure sounds typical until you realize it only includes settlements big enough that somebody published them, which leaves out most of the cases that actually happen.
How much is the average car accident settlement?
IRC data puts the median at roughly $31,000. If you hire an attorney, the average jumps to around $77,600, and study after study shows represented claimants recovering about 3.5 times more than people who handle it themselves. One firm reports an average of $37,248 across 4,500 of its own car crash cases. A minor soft tissue claim commonly settles between $10,000 and $15,000. Cases involving surgery or permanent impairment move into six figures.
How do insurance companies calculate a settlement?
They add up your economic damages, the medical bills, lost wages, and property damage, then multiply that total by a number between 1.5 and 5 to put a dollar figure on pain and suffering. A minor soft tissue injury sits near 1.5. Surgery or a long recovery pushes it toward 3. Permanent disability gets you to 5. Most large insurers do not leave this to the adjuster's gut feeling. They run everything through software like Colossus or Claims IQ, which produces a range the adjuster negotiates within.
What is the multiplier method?
It is the standard way adjusters and attorneys value pain and suffering. You take your economic damages and multiply them by a factor between 1.5 and 5, then add that result back on top. So on $25,000 of medical bills with a moderate multiplier of 3, pain and suffering comes to $75,000, giving you $100,000 before lost wages, fault reduction, or policy limits enter the picture. This multiplier is the single most argued-over number in any settlement negotiation.
Can I recover more than the insurance policy limit?
Usually not from that one policy. The limit is a hard ceiling no matter how badly you were hurt. A claim worth $200,000 against a driver who only carries $50,000 in coverage is, practically speaking, a $50,000 claim. But other layers of coverage are worth looking for: excess or umbrella policies, employer liability if the driver was working, commercial policies which often carry $1 million or more, and your own uninsured or underinsured motorist coverage. Suing the individual personally beyond their policy is technically possible, but collecting on that judgment is a different story.
How much is a slip and fall settlement worth?
Most published ranges fall between $10,000 and $50,000 for cases involving sprains, minor fractures, or temporary mobility issues. When the fall produces a head injury, a hip fracture, or requires surgery, values move into the $100,000 to $400,000 range. These claims tend to settle lower than car accidents, and the reason is not lighter injuries. It is that proving liability is harder. You have to show the property owner knew about the hazard or should have known, and without maintenance logs or surveillance footage, that is a tough hill to climb.
What is the average dog bite settlement?
Insurance Information Institute data puts the average claim at roughly $69,272, drawn from about $1.57 billion in total industry payouts. Individual cases range anywhere from a few thousand to several hundred thousand dollars. What is interesting is that publicly reported settlements cluster tightly around $300,000 to $310,000, a suspiciously narrow band. That pattern strongly suggests homeowner policy limits are driving the outcomes more than the specific facts of each bite.
What is the average medical malpractice settlement?
National Practitioner Data Bank figures put the average payout at roughly $348,065. Cases that go all the way to trial average closer to $1 million. Malpractice claims carry higher values because the harm tends to be severe, but they also cost more to pursue because you need expert witnesses and the discovery process drags on. On top of that, many states impose statutory caps on non-economic damages for malpractice specifically, which can limit what you recover no matter how strong the underlying case is.
How does being partly at fault affect my settlement?
It comes down to which rule your state follows, and there are three. Pure comparative negligence states like California and New York reduce your recovery by your percentage of fault with no floor, so even a claimant found 80 percent at fault still recovers 20 percent. Modified comparative states, including Florida since its 2023 tort reform, cut you off entirely once you hit 50 or 51 percent depending on the jurisdiction. And a few contributory negligence states bar recovery for any fault at all, so being even 1 percent responsible means you collect nothing.
Is a personal injury settlement taxable?
Mostly not. Internal Revenue Code section 104(a)(2) excludes damages received on account of personal physical injuries or physical sickness from gross income. That covers medical expenses, pain and suffering, loss of consortium, emotional distress arising from the injury, and, unusually, lost wages. Lost wages are taxable in almost every other kind of claim but are excluded in a physical injury case. Punitive damages are always taxable regardless of the underlying injury, as is interest accrued on the settlement, emotional distress not arising from a physical injury, and medical costs you previously deducted. How the settlement agreement allocates the total between these categories directly determines the tax bill, which is why allocation should be settled before signing.
Why do settlements take so long?
Because the case cannot be properly valued until you reach maximum medical improvement, the point where your doctors can say your condition has stabilized and estimate what future care will cost. If you settle before that, you are locking in a number based on treatment you have already had rather than treatment you are going to need, and once you sign, there is no going back. Car accident claims typically resolve within a few months to a year. Medical malpractice takes quite a bit longer, often 18 to 36 months more, because of expert testimony and discovery. About 95 percent of personal injury cases settle without ever reaching a courtroom.
Economic damages, multiplier, fault reduction and net after fees. Free, no signup.
Calculate My Settlement